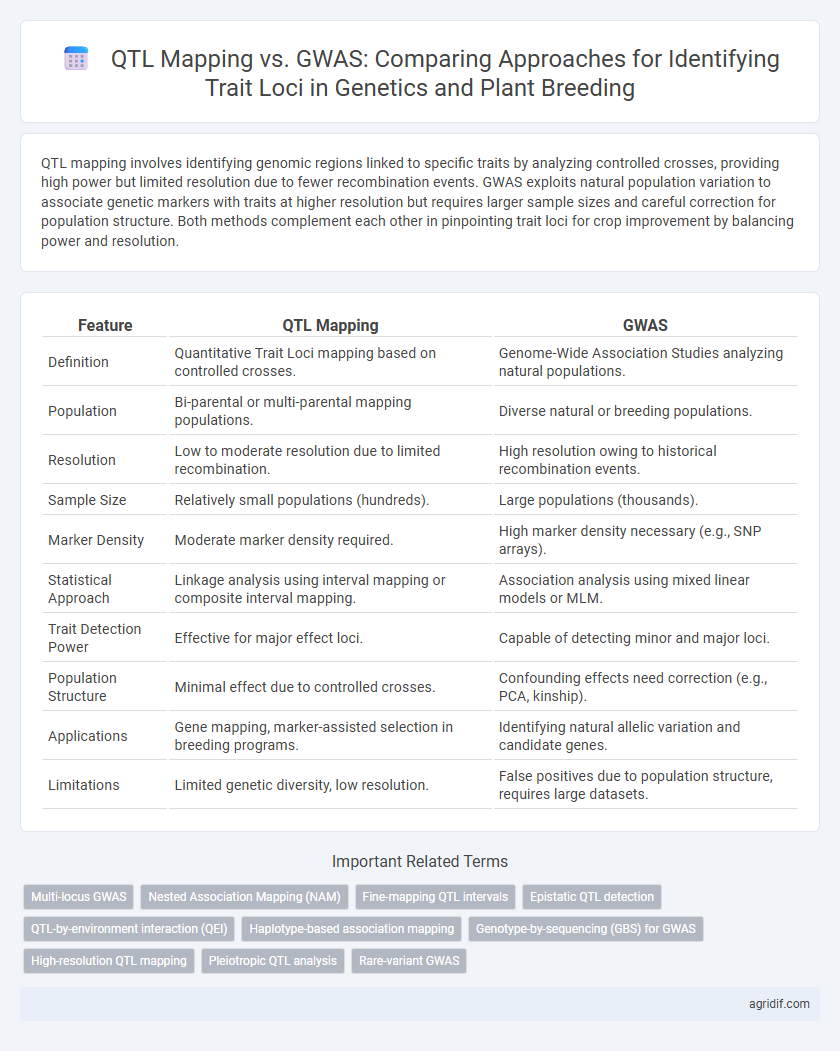
QTL mapping involves identifying genomic regions linked to specific traits by analyzing controlled crosses, providing high power but limited resolution due to fewer recombination events. GWAS exploits natural population variation to associate genetic markers with traits at higher resolution but requires larger sample sizes and careful correction for population structure. Both methods complement each other in pinpointing trait loci for crop improvement by balancing power and resolution.
Table of Comparison
| Feature | QTL Mapping | GWAS |
|---|---|---|
| Definition | Quantitative Trait Loci mapping based on controlled crosses. | Genome-Wide Association Studies analyzing natural populations. |
| Population | Bi-parental or multi-parental mapping populations. | Diverse natural or breeding populations. |
| Resolution | Low to moderate resolution due to limited recombination. | High resolution owing to historical recombination events. |
| Sample Size | Relatively small populations (hundreds). | Large populations (thousands). |
| Marker Density | Moderate marker density required. | High marker density necessary (e.g., SNP arrays). |
| Statistical Approach | Linkage analysis using interval mapping or composite interval mapping. | Association analysis using mixed linear models or MLM. |
| Trait Detection Power | Effective for major effect loci. | Capable of detecting minor and major loci. |
| Population Structure | Minimal effect due to controlled crosses. | Confounding effects need correction (e.g., PCA, kinship). |
| Applications | Gene mapping, marker-assisted selection in breeding programs. | Identifying natural allelic variation and candidate genes. |
| Limitations | Limited genetic diversity, low resolution. | False positives due to population structure, requires large datasets. |
Introduction to Trait Loci Identification in Plant Breeding
QTL mapping and GWAS are pivotal genetic approaches used to identify trait loci in plant breeding, each offering distinct advantages in resolution and population scope. QTL mapping involves crossing genetically diverse parents to detect loci linked to specific traits in controlled populations, providing insights into major effect loci. GWAS leverages historical recombination events in natural populations, enabling fine-scale mapping of complex traits through genome-wide marker-trait associations.
Overview of QTL Mapping: Principles and Applications
QTL mapping identifies genomic regions associated with quantitative traits by analyzing linkage between genetic markers and phenotypic variation within controlled populations, such as F2 or recombinant inbred lines. Its applications include dissecting complex traits like yield, disease resistance, and abiotic stress tolerance in crops by pinpointing loci that contribute to trait variability. This approach enables marker-assisted selection and accelerates breeding programs by providing precise genetic information for trait improvement.
Fundamentals of GWAS: Methods and Approaches
GWAS (Genome-Wide Association Studies) identify trait loci by scanning the entire genome for genetic variants correlated with phenotypic traits, leveraging large populations and high-density SNP markers. This method uses statistical models such as mixed linear models to control for population structure and kinship, improving the accuracy of association signals. Compared to QTL mapping, which relies on biparental populations, GWAS provides higher resolution and broader applicability across diverse genetic backgrounds.
Comparative Advantages of QTL Mapping and GWAS
QTL mapping offers high power in detecting loci with large effects by analyzing controlled biparental populations, providing precise linkage information and facilitating marker-assisted selection. GWAS enables the detection of multiple loci with smaller effects across diverse natural populations, leveraging historical recombination events for higher resolution mapping. Combining QTL mapping and GWAS enhances the identification of complex trait loci by balancing power, resolution, and population diversity in genetics and plant breeding research.
Limitations and Challenges of QTL Mapping
QTL mapping faces limitations such as low resolution due to linkage disequilibrium and reliance on bi-parental populations, which restricts genetic diversity and the detection of minor effect loci. The method often requires large population sizes and extensive phenotyping, increasing time and resource demands. Environmental interactions frequently complicate the identification of stable QTLs across different conditions, reducing the reliability of mapping results.
Limitations and Challenges of GWAS
GWAS faces challenges such as limited power to detect rare variants and small effect sizes due to the need for large sample sizes and stringent statistical corrections. Population stratification can cause false-positive associations, complicating the identification of true trait loci. Unlike QTL mapping, GWAS often struggles with dissecting complex traits in diverse populations because of genetic heterogeneity and environmental interactions.
Data Requirements for QTL Mapping vs GWAS
QTL mapping requires controlled biparental populations such as F2, backcross, or recombinant inbred lines, with relatively smaller sample sizes but comprehensive phenotypic and genotypic data for accurate locus identification. GWAS relies on large, diverse natural populations with high-density genome-wide marker data to detect associations between markers and traits, demanding extensive computational resources for population structure correction. The data resolution in GWAS typically surpasses QTL mapping due to higher marker density and historical recombination events, but QTL mapping benefits from simpler experimental designs and clearer genetic backgrounds.
Statistical Models Used in QTL Mapping and GWAS
QTL mapping primarily employs linear mixed models and interval mapping to associate phenotypic traits with specific genomic regions using biparental populations, allowing precise estimation of allelic effects. In contrast, GWAS utilizes mixed linear models and multi-locus models across diverse natural populations to detect marker-trait associations accounting for population structure and kinship, enhancing resolution and statistical power. Both approaches rely on statistical frameworks designed to control false positives while identifying significant quantitative trait loci influencing complex traits in plants.
Practical Applications in Crop Improvement
QTL mapping excels in identifying major effect loci within biparental populations, facilitating targeted gene pyramiding for key traits like disease resistance and yield stability in crops. GWAS offers high-resolution detection of trait-associated variants across diverse germplasm, enabling the discovery of novel alleles for complex traits such as stress tolerance and nutrient efficiency. Both approaches complement each other in plant breeding pipelines by integrating QTL-derived markers with GWAS insights to accelerate marker-assisted selection and genomic prediction.
Future Perspectives: Integrating QTL Mapping and GWAS
Integrating QTL mapping and GWAS leverages the high resolution of GWAS with the robust detection power of QTL mapping to enhance genetic dissection of complex traits. Future perspectives emphasize the development of hybrid analytical frameworks that combine linkage analysis and association mapping to improve accuracy in identifying trait loci in diverse plant populations. This integration facilitates precision breeding by enabling the identification of candidate genes underpinning agronomically important traits with greater confidence.
Related Important Terms
Multi-locus GWAS
Multi-locus GWAS enhances the resolution and power of traditional QTL mapping by simultaneously analyzing multiple genetic loci, enabling the detection of complex trait loci with small effects in diverse plant populations. This approach improves the accuracy of identifying candidate genes for traits such as yield, disease resistance, and stress tolerance, facilitating more efficient marker-assisted selection in plant breeding programs.
Nested Association Mapping (NAM)
Nested Association Mapping (NAM) combines the high resolution of Genome-Wide Association Studies (GWAS) with the power of linkage analysis from Quantitative Trait Locus (QTL) mapping by using a structured population derived from multiple parental lines, facilitating accurate identification of trait loci with enhanced statistical power. This integrative approach leverages recombination events across diverse subpopulations, enabling precise dissection of complex traits in plant breeding programs.
Fine-mapping QTL intervals
QTL mapping enables the detection of genomic regions associated with traits by analyzing linkage in controlled populations, providing relatively broad QTL intervals suitable for initial localization. GWAS leverages natural population diversity to achieve higher resolution and finer mapping of trait-associated loci, allowing for more precise identification of candidate genes within narrow genomic intervals.
Epistatic QTL detection
QTL mapping excels in detecting epistatic QTL interactions due to its controlled biparental population structure, enabling precise identification of gene-gene interactions influencing complex traits. GWAS, while powerful for high-resolution association mapping across diverse populations, often faces challenges in epistatic QTL detection because of confounding population structure and lower statistical power for interaction effects.
QTL-by-environment interaction (QEI)
QTL mapping excels in detecting QTL-by-environment interactions (QEI) by analyzing controlled bi-parental populations, allowing precise dissection of environment-specific allele effects on complex traits. In contrast, GWAS offers broader allele diversity but often faces challenges in capturing QEI due to population structure and environmental heterogeneity, highlighting QTL mapping's advantage in environment-responsive trait locus identification.
Haplotype-based association mapping
Haplotype-based association mapping in QTL Mapping and GWAS enhances the resolution of identifying trait loci by capturing linkage disequilibrium patterns across multiple SNPs, offering improved detection power over single SNP analyses. This approach is particularly effective in dissecting complex traits in plant breeding by leveraging haplotype blocks to pinpoint candidate genes and allelic variations influencing phenotypic diversity.
Genotype-by-sequencing (GBS) for GWAS
Genotype-by-sequencing (GBS) enhances GWAS by enabling high-density SNP discovery and genotyping across diverse plant populations, increasing the resolution and accuracy in identifying quantitative trait loci (QTL) associated with complex traits. Compared to traditional QTL mapping, GBS-based GWAS captures broader genetic variation and recombination events, facilitating the detection of alleles with minor effects influencing phenotypic traits in plant breeding programs.
High-resolution QTL mapping
High-resolution QTL mapping offers precise localization of trait loci by integrating dense genotype data with detailed phenotypic information, enabling the dissection of complex traits. Compared to GWAS, it provides superior resolution in structured populations, facilitating the identification of candidate genes underlying quantitative traits.
Pleiotropic QTL analysis
QTL mapping provides precise localization of pleiotropic loci influencing multiple traits within bi-parental populations, while GWAS leverages natural diversity to identify pleiotropic QTL at higher resolution across broader genetic backgrounds. Combining QTL mapping with GWAS enhances the detection and validation of candidate pleiotropic genes controlling complex traits in crop improvement programs.
Rare-variant GWAS
Rare-variant GWAS enhances the discovery of low-frequency alleles influencing complex traits, providing higher resolution than traditional QTL mapping which often captures common variant effects in biparental populations. Integrating rare-variant GWAS with haplotype-based analyses allows precise localization of trait loci, critical for genetic improvement in diverse plant breeding populations.
QTL Mapping vs GWAS for Identifying Trait Loci Infographic