Leaf wetness duration is a critical parameter in agricultural meteorology for predicting fungal and bacterial diseases, as prolonged moisture on leaf surfaces promotes pathogen development. Relative humidity influences leaf wetness by affecting moisture condensation and evaporation rates, with higher humidity generally extending the wetness period. Accurate monitoring of both leaf wetness duration and relative humidity enhances disease forecasting models, enabling timely interventions to protect crops.
Table of Comparison
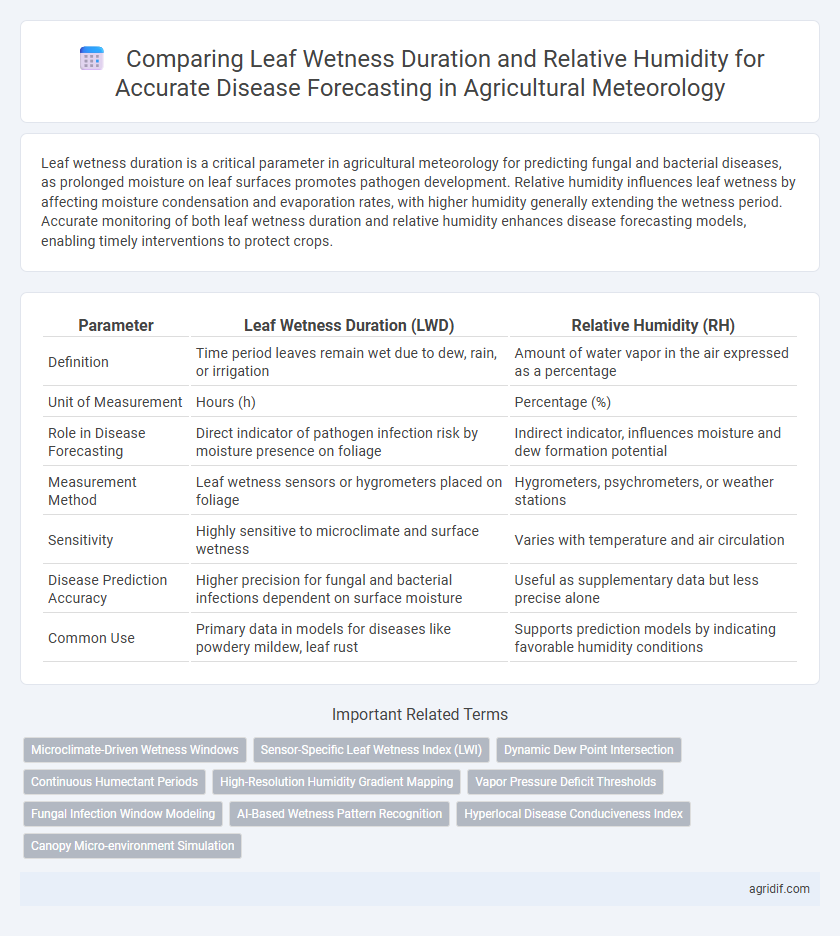
| Parameter | Leaf Wetness Duration (LWD) | Relative Humidity (RH) |
|---|---|---|
| Definition | Time period leaves remain wet due to dew, rain, or irrigation | Amount of water vapor in the air expressed as a percentage |
| Unit of Measurement | Hours (h) | Percentage (%) |
| Role in Disease Forecasting | Direct indicator of pathogen infection risk by moisture presence on foliage | Indirect indicator, influences moisture and dew formation potential |
| Measurement Method | Leaf wetness sensors or hygrometers placed on foliage | Hygrometers, psychrometers, or weather stations |
| Sensitivity | Highly sensitive to microclimate and surface wetness | Varies with temperature and air circulation |
| Disease Prediction Accuracy | Higher precision for fungal and bacterial infections dependent on surface moisture | Useful as supplementary data but less precise alone |
| Common Use | Primary data in models for diseases like powdery mildew, leaf rust | Supports prediction models by indicating favorable humidity conditions |
Understanding Leaf Wetness Duration in Plant Disease Forecasting
Leaf Wetness Duration (LWD) serves as a critical parameter in plant disease forecasting by quantifying the period during which leaf surfaces remain moist, directly influencing pathogen infection rates. Precise measurement of LWD, often through specialized sensors, helps predict fungal and bacterial disease outbreaks by correlating wetness periods with pathogen life cycles. Integrating LWD with relative humidity data enhances the accuracy of epidemiological models, enabling timely interventions in crop protection strategies.
Role of Relative Humidity in Agricultural Meteorology
Relative humidity plays a critical role in agricultural meteorology by influencing leaf wetness duration, which is a key factor for disease forecasting in crops. High relative humidity levels extend the period of leaf wetness, thereby creating favorable conditions for the development of fungal and bacterial pathogens. Accurate monitoring of relative humidity helps in predicting disease outbreaks, enabling timely interventions and effective crop protection strategies.
Comparing Leaf Wetness Duration and Relative Humidity: Key Differences
Leaf Wetness Duration (LWD) directly measures the time surfaces remain wet, providing critical data for predicting foliar disease development based on moisture availability for pathogen growth. Relative Humidity (RH), while indicating atmospheric moisture content, often fluctuates without necessarily causing surface wetness needed for spore germination and infection. LWD offers more precise disease forecasting inputs than RH by reflecting actual wet conditions on plant surfaces, crucial for risk assessment in agricultural meteorology.
Importance of Accurate Disease Forecasting for Crop Protection
Accurate disease forecasting based on leaf wetness duration and relative humidity is critical for effective crop protection, enabling timely fungicide applications and reducing unnecessary chemical use. Monitoring these microclimatic factors enhances predictive models for diseases such as powdery mildew and late blight, minimizing crop losses and improving yield quality. Precision in assessing leaf wetness duration and relative humidity supports sustainable agricultural practices by optimizing disease management strategies.
Measurement Techniques: Leaf Wetness vs Relative Humidity Sensors
Leaf wetness duration sensors provide direct and accurate measurements of moisture on crop surfaces, crucial for predicting fungal disease outbreaks, whereas relative humidity sensors estimate atmospheric moisture indirectly. Leaf wetness sensors typically employ electrical resistance or dielectric properties to detect surface wetness, offering localized data essential for microclimate disease models. In contrast, relative humidity sensors use capacitive or thermal methods to gauge air moisture, which may not always correlate precisely with surface wetness, affecting forecast accuracy in diverse agricultural environments.
Influence of Microclimate on Leaf Wetness and Humidity Readings
Microclimate factors significantly influence leaf wetness duration and relative humidity measurements critical for accurate disease forecasting in agricultural meteorology. Variations in canopy structure, soil moisture, and local airflow patterns cause heterogeneous microclimatic conditions that affect dew formation and persistence on leaf surfaces. Precise monitoring of these microenvironmental variables enhances predictive models for foliar disease outbreaks, improving crop protection strategies.
Case Studies: Disease Outbreaks Linked to LWD and RH
Case studies on agricultural disease outbreaks reveal a strong correlation between leaf wetness duration (LWD) and relative humidity (RH) levels, where prolonged LWD combined with RH above 85% significantly increases the incidence of fungal diseases such as powdery mildew and late blight. Research in cereal crops has demonstrated that monitoring LWD alongside RH provides more accurate disease forecasting models, enabling timely fungicide applications and reducing yield losses. Field data from regions with high humidity and frequent dew formation underscore the critical role of these microclimatic variables in triggering pathogen development and epidemic outbreaks.
Integrating LWD and RH in Predictive Disease Models
Integrating Leaf Wetness Duration (LWD) and Relative Humidity (RH) enhances the accuracy of predictive disease models by capturing critical microclimatic conditions that favor pathogen development. The combined analysis of LWD and RH parameters enables precise forecasting of foliar diseases, improving early warning systems for crop management. Advanced models utilizing both LWD and RH data support timely interventions, reducing yield loss and optimizing fungicide application in agricultural meteorology.
Limitations of Relying Solely on Relative Humidity Data
Relative humidity alone often fails to accurately predict leaf wetness duration, a critical factor for fungal disease development in crops. Variability in microclimate conditions and dew formation processes limits the reliability of RH measurements for disease forecasting. Integrating direct leaf wetness sensors with RH data enhances the precision of predictive models in agricultural meteorology.
Future Directions: Advanced Forecasting Tools in Agro-Meteorology
Future directions in agricultural meteorology emphasize integrating leaf wetness duration and relative humidity data into AI-driven disease forecasting models to improve prediction accuracy. The development of high-resolution sensor networks combined with machine learning algorithms enables real-time monitoring and early warning systems for crop disease outbreaks. Enhanced data assimilation from remote sensing and ground-based observations promises to optimize fungicide application timing and reduce crop losses.
Related Important Terms
Microclimate-Driven Wetness Windows
Leaf Wetness Duration (LWD) closely correlates with Relative Humidity (RH) levels, where microclimate-driven wetness windows emerge as critical periods for fungal spore germination and infection in crops. Precise monitoring of RH fluctuations within crop canopies enables accurate disease forecasting by identifying timeframes conducive to pathogen development and guiding targeted interventions.
Sensor-Specific Leaf Wetness Index (LWI)
The Sensor-Specific Leaf Wetness Index (LWI) integrates real-time leaf wetness duration measurements with concurrent relative humidity data to improve the accuracy of disease forecasting in crops. Calibrating LWI sensors to local microclimatic conditions enhances the prediction of fungal and bacterial pathogen risks by capturing critical moisture periods conducive to infection.
Dynamic Dew Point Intersection
Leaf wetness duration directly influences pathogen development, and its correlation with relative humidity can be precisely analyzed through the dynamic dew point intersection, which indicates the critical threshold when leaf surface moisture begins to form. Monitoring this intersection improves disease forecasting accuracy by identifying optimal periods for fungal spore germination and infection risk in crops.
Continuous Humectant Periods
Continuous humectant periods, defined by sustained leaf wetness duration exceeding specific thresholds under high relative humidity (RH) conditions, critically influence the onset and severity of foliar diseases in crops. Precise monitoring using leaf wetness sensors alongside RH measurements enables accurate disease forecasting models by identifying extended periods of moisture availability necessary for pathogen germination and infection.
High-Resolution Humidity Gradient Mapping
High-resolution humidity gradient mapping enhances the precision of leaf wetness duration models by capturing microclimatic variations critical for fungal and bacterial disease forecasting in crops. Integrating fine-scale relative humidity data with leaf wetness sensors allows for more accurate prediction of infection periods, optimizing timely fungicide applications and improving crop health management.
Vapor Pressure Deficit Thresholds
Leaf wetness duration is a critical parameter influenced by relative humidity levels, where extended wetness combined with low vapor pressure deficit (VPD) thresholds increases the risk of fungal disease outbreaks in crops. Monitoring VPD thresholds alongside leaf wetness duration enhances the precision of disease forecasting models, enabling timely and targeted agricultural interventions.
Fungal Infection Window Modeling
Leaf wetness duration closely correlates with relative humidity levels, providing critical data for accurately modeling fungal infection windows in crop disease forecasting. Integrating precise measurements of leaf wetness duration and relative humidity enhances early detection of conducive conditions for fungal spore germination and infection onset.
AI-Based Wetness Pattern Recognition
AI-based wetness pattern recognition leverages machine learning algorithms to analyze leaf wetness duration and relative humidity data, enhancing the precision of disease forecasting in agricultural meteorology. By accurately identifying wetness conditions conducive to pathogen development, AI models improve early detection of crop diseases, enabling timely preventive actions and optimizing crop management strategies.
Hyperlocal Disease Conduciveness Index
Leaf Wetness Duration (LWD) serves as a crucial indicator for pathogen infection risk, with higher Relative Humidity (RH) levels typically extending LWD and thereby increasing disease pressure in crops. The Hyperlocal Disease Conduciveness Index leverages real-time LWD and RH data at fine spatial scales to improve accuracy in forecasting disease outbreaks, enabling targeted intervention and optimized fungicide application in precision agriculture.
Canopy Micro-environment Simulation
Leaf wetness duration (LWD) strongly correlates with relative humidity (RH) levels in canopy micro-environments, influencing the onset and severity of foliar diseases by creating favorable conditions for pathogen development. Advanced canopy micro-environment simulation models integrate LWD and RH data to enhance disease forecasting accuracy, enabling targeted interventions in precision agriculture.
Leaf Wetness Duration vs Relative Humidity for Disease Forecasting Infographic