Thermal stress and frost damage both critically impact crop yield by disrupting physiological processes essential for growth and development. Excessive heat leads to reduced photosynthesis and accelerated water loss, often causing irreversible tissue damage, while frost causes ice formation within plant cells, resulting in cellular rupture and impaired nutrient transport. Understanding and mitigating these temperature extremes are vital for minimizing yield risk and ensuring stable agricultural productivity.
Table of Comparison
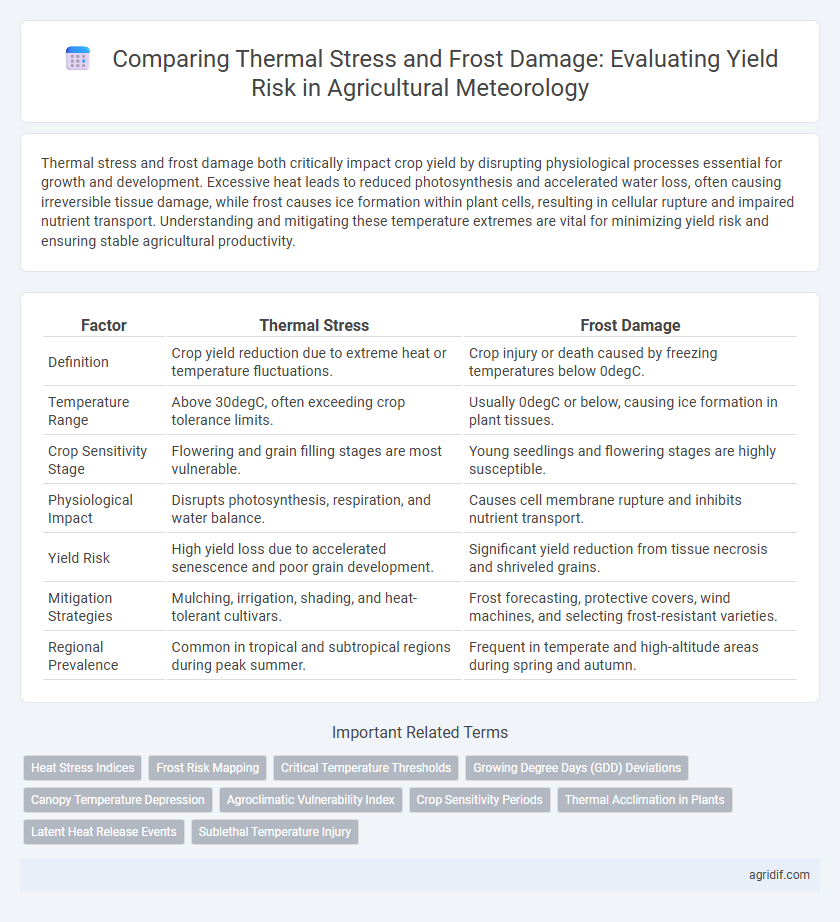
| Factor | Thermal Stress | Frost Damage |
|---|---|---|
| Definition | Crop yield reduction due to extreme heat or temperature fluctuations. | Crop injury or death caused by freezing temperatures below 0degC. |
| Temperature Range | Above 30degC, often exceeding crop tolerance limits. | Usually 0degC or below, causing ice formation in plant tissues. |
| Crop Sensitivity Stage | Flowering and grain filling stages are most vulnerable. | Young seedlings and flowering stages are highly susceptible. |
| Physiological Impact | Disrupts photosynthesis, respiration, and water balance. | Causes cell membrane rupture and inhibits nutrient transport. |
| Yield Risk | High yield loss due to accelerated senescence and poor grain development. | Significant yield reduction from tissue necrosis and shriveled grains. |
| Mitigation Strategies | Mulching, irrigation, shading, and heat-tolerant cultivars. | Frost forecasting, protective covers, wind machines, and selecting frost-resistant varieties. |
| Regional Prevalence | Common in tropical and subtropical regions during peak summer. | Frequent in temperate and high-altitude areas during spring and autumn. |
Understanding Thermal Stress and Frost Damage in Agriculture
Thermal stress in agriculture primarily arises from extreme temperature fluctuations that disrupt plant metabolic processes, leading to reduced photosynthesis and impaired growth. Frost damage occurs when ice crystals form within plant tissues at subzero temperatures, causing cellular injury and tissue death that directly jeopardize crop yield and quality. Understanding these distinct physiological impacts enables farmers to implement targeted management strategies to mitigate yield risk during critical growth periods.
Key Differences Between Thermal Stress and Frost Damage
Thermal stress in crops results from prolonged exposure to extreme heat, causing cellular damage and impaired photosynthesis, while frost damage arises from freezing temperatures that lead to ice formation within plant tissues, rupturing cells. Yield risk from thermal stress is primarily linked to heatwaves and prolonged high temperatures affecting crop growth stages, whereas frost damage risk is most critical during sensitive phenological phases such as flowering and early fruit set. Understanding these distinct physiological impacts enables targeted mitigation strategies in agricultural meteorology to preserve crop productivity under varying climatic threats.
Mechanisms of Crop Yield Loss from High Temperatures
High temperatures induce thermal stress by accelerating plant respiration rates, leading to reduced photosynthetic efficiency and diminished carbohydrate accumulation crucial for grain filling. Elevated heat disrupts enzymatic functions and membrane stability, causing cellular damage and impairing reproductive development, which results in sterility and lower yield potential. Unlike frost damage that causes cell rupture through ice crystallization, thermal stress primarily affects metabolic processes and phenological timing, increasing yield risk by shortening the grain-filling period and reducing final biomass.
Frost Events: Impact on Plant Physiology and Yield
Frost events cause cellular damage in plants by forming ice crystals that disrupt membrane integrity, leading to impaired photosynthesis and nutrient transport, which directly reduces crop yield. Thermal stress during frost periods exacerbates the risk by limiting plant recovery, increasing susceptibility to diseases, and altering phenological stages critical for growth. Understanding the interaction between frost damage and thermal stress is essential for developing agro-meteorological models that forecast yield risk and guide adaptive management strategies.
Temperature Thresholds: Defining Risk Periods for Crops
Thermal stress and frost damage significantly impact crop yields by exceeding critical temperature thresholds that define risk periods for various growth stages. Crops experience heat stress when temperatures rise above species-specific upper limits, typically between 30degC and 40degC, causing reduced photosynthesis and accelerated phenological development. Conversely, frost damage occurs at temperatures below 0degC to -3degC depending on crop sensitivity, leading to cellular injury and potentially irreversible yield loss during vulnerable periods such as flowering or early fruit set.
Regional Vulnerability: Climate Zones and Risk Assessment
Thermal stress and frost damage significantly influence crop yield risks across varied climate zones, with tropical and temperate regions displaying distinct vulnerability patterns due to differential temperature fluctuations. Regional risk assessment integrates temperature thresholds, phenological stages, and local meteorological data to predict crop susceptibility and inform adaptive agricultural practices. Accurate spatial analysis enhances targeted interventions, reducing yield variability attributed to thermal extremes and frost events in vulnerable agro-climatic zones.
Crop Sensitivity: Species and Growth Stage Considerations
Crop sensitivity to thermal stress and frost damage varies significantly by species and growth stage, influencing yield risk in agricultural meteorology. For example, sensitive crops like wheat and fruit trees face critical threats during flowering and early fruit set, where low temperatures can induce frost damage and reduce yield potential. Understanding species-specific tolerance thresholds and timing of development stages optimizes risk management strategies and crop protection measures.
Management Strategies for Mitigating Thermal Stress
Implementing adaptive irrigation scheduling based on real-time temperature monitoring effectively reduces crop thermal stress, enhancing yield stability. Utilizing heat-tolerant crop varieties and applying mulching techniques help maintain soil moisture and moderate microclimate temperatures. Leveraging agro-meteorological forecasts allows proactive management decisions to mitigate the adverse impacts of extreme thermal conditions on crop productivity.
Frost Protection Techniques and Their Effectiveness
Frost protection techniques such as wind machines, sprinklers, and row covers mitigate yield risk by maintaining crop tissue temperature above critical freezing points during cold snaps. Studies indicate that wind machines improve air mixing, reducing temperature inversion effects and lowering frost damage incidence by up to 30%. Sprinkler irrigation forms an insulating ice layer on plants, effectively preventing intracellular ice formation and preserving yield quality under frost stress.
Integrating Meteorological Data for Yield Risk Prediction
Integrating meteorological data such as temperature fluctuations, humidity levels, and solar radiation enhances the accuracy of predicting yield risk associated with thermal stress and frost damage in crops. Advanced modeling techniques utilize this data to identify critical periods of vulnerability, enabling proactive management strategies that mitigate losses. Real-time weather monitoring combined with historical climate patterns supports robust forecasts, improving decision-making for agricultural stakeholders.
Related Important Terms
Heat Stress Indices
Heat stress indices, such as the Crop Heat Stress Index (CHSI) and the Heat Stress Degree Days (HSDD), quantitatively assess the impact of elevated temperatures on crop physiology, providing critical metrics for predicting yield risk under thermal stress conditions. These indices complement frost damage assessments by highlighting periods where excessive heat accelerates phenological development and impairs reproductive processes, ultimately affecting crop productivity.
Frost Risk Mapping
Frost risk mapping integrates temperature thresholds and crop phenology to identify zones susceptible to frost damage, thereby enabling targeted mitigation strategies in agricultural meteorology. Accurate spatial analysis of frost occurrence helps quantify yield risk by correlating thermal stress data with vulnerability periods during crop development.
Critical Temperature Thresholds
Critical temperature thresholds in agricultural meteorology distinctly influence yield risk, with thermal stress typically occurring above 30degC causing reduced photosynthesis and crop growth, while frost damage happens below 0degC, leading to cellular injury and impaired reproductive development. Understanding these thresholds enables precise management strategies to mitigate yield loss by optimizing planting schedules and protective measures against extreme temperature fluctuations.
Growing Degree Days (GDD) Deviations
Thermal stress and frost damage critically affect crop yield risk by altering Growing Degree Days (GDD) accumulation, where deviations from optimal GDD ranges disrupt phenological development and reduce productivity. Variability in GDD due to thermal extremes can accelerate or delay growth stages, increasing susceptibility to both heat stress and frost events, thereby magnifying yield losses in sensitive crops.
Canopy Temperature Depression
Canopy Temperature Depression (CTD) effectively distinguishes thermal stress from frost damage by measuring the temperature differential between the crop canopy and the surrounding air, providing an early indicator of plant stress that can significantly impact yield risk. Precise monitoring of CTD enables timely agricultural interventions, mitigating losses caused by excessive heat or freezing temperatures and optimizing crop resilience and productivity.
Agroclimatic Vulnerability Index
The Agroclimatic Vulnerability Index integrates thermal stress and frost damage parameters to quantitatively assess yield risk by evaluating temperature extremes' impact on crop phenology and productivity. This index facilitates targeted adaptation strategies by mapping regions with heightened susceptibility to thermal anomalies and frost incidence, thereby optimizing agro-meteorological risk management.
Crop Sensitivity Periods
Crop sensitivity periods critically determine the impact of thermal stress and frost damage on yield risk, as exposure to extreme temperatures during flowering or grain filling stages drastically reduces productivity. Thermal stress during heat-sensitive phases accelerates crop development, leading to reduced grain size, while frost damage in vulnerable periods causes cellular injury and reproductive failure, significantly lowering harvest outcomes.
Thermal Acclimation in Plants
Thermal acclimation in plants enhances their ability to withstand temperature fluctuations, reducing yield risk associated with thermal stress and frost damage. By modulating physiological and biochemical pathways, crops improve cold tolerance, thereby minimizing cellular injury during frost events and maintaining productivity under thermal stress conditions.
Latent Heat Release Events
Latent heat release events mitigate yield risk in agricultural meteorology by moderating thermal stress and reducing frost damage during critical growth phases. These events influence microclimate stability, enhancing crop resilience against temperature extremes through the release of stored energy in phase transitions of water.
Sublethal Temperature Injury
Sublethal temperature injury in agricultural meteorology refers to thermal stress conditions that do not immediately kill crops but impair physiological functions, reducing yield potentials by disrupting cell membranes and enzyme activities. Unlike frost damage which causes visible tissue necrosis, sublethal injury leads to subtle growth retardation and increased susceptibility to diseases, thereby elevating long-term yield risk.
Thermal Stress vs Frost Damage for Yield Risk Infographic