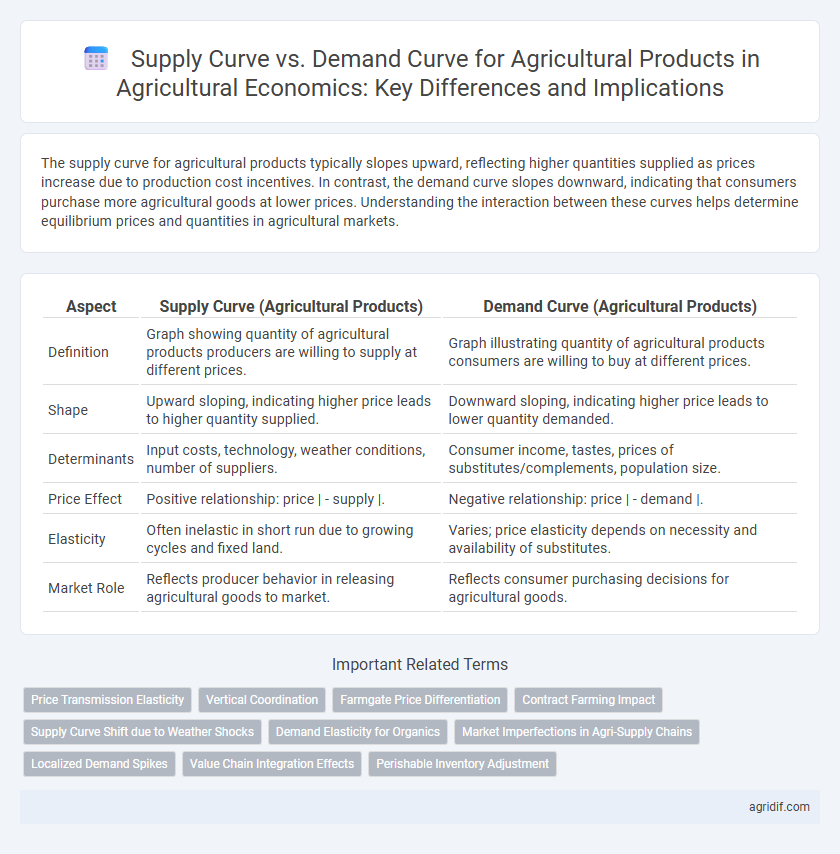
The supply curve for agricultural products typically slopes upward, reflecting higher quantities supplied as prices increase due to production cost incentives. In contrast, the demand curve slopes downward, indicating that consumers purchase more agricultural goods at lower prices. Understanding the interaction between these curves helps determine equilibrium prices and quantities in agricultural markets.
Table of Comparison
| Aspect | Supply Curve (Agricultural Products) | Demand Curve (Agricultural Products) |
|---|---|---|
| Definition | Graph showing quantity of agricultural products producers are willing to supply at different prices. | Graph illustrating quantity of agricultural products consumers are willing to buy at different prices. |
| Shape | Upward sloping, indicating higher price leads to higher quantity supplied. | Downward sloping, indicating higher price leads to lower quantity demanded. |
| Determinants | Input costs, technology, weather conditions, number of suppliers. | Consumer income, tastes, prices of substitutes/complements, population size. |
| Price Effect | Positive relationship: price | - supply |. | Negative relationship: price | - demand |. |
| Elasticity | Often inelastic in short run due to growing cycles and fixed land. | Varies; price elasticity depends on necessity and availability of substitutes. |
| Market Role | Reflects producer behavior in releasing agricultural goods to market. | Reflects consumer purchasing decisions for agricultural goods. |
Understanding the Supply Curve in Agriculture
The supply curve in agriculture illustrates the relationship between the price of agricultural products and the quantity farmers are willing to produce and sell, typically sloping upward due to higher prices incentivizing increased production. Factors influencing the agricultural supply curve include input costs, weather conditions, technological advancements, and government policies such as subsidies and tariffs. Understanding these determinants enables economists to predict shifts in supply, assess market equilibrium, and inform policy decisions impacting food security and farm income.
The Demand Curve for Agricultural Products
The demand curve for agricultural products typically slopes downward, indicating that as prices decrease, the quantity demanded increases due to the necessity and price sensitivity of consumers. Factors such as consumer income, population growth, and preferences directly influence shifts in demand, making it relatively inelastic in the short term but more elastic over time. Understanding the demand curve helps farmers and policymakers predict market reactions and make informed decisions regarding production and pricing strategies.
Key Factors Shaping Agricultural Supply
Agricultural supply curves are largely influenced by input costs, technological advancements, and weather conditions, which determine the quantity of crops or livestock that producers are willing to offer at various price points. In contrast, demand curves for agricultural products are driven by consumer preferences, population growth, and income levels, affecting the quantity demanded at different prices. Understanding the elasticity of supply in response to changes in prices and external factors is crucial for predicting market trends and policymaking in agricultural economics.
Determinants Influencing Agricultural Demand
Agricultural demand curves are influenced primarily by consumer income levels, population growth, and preferences for food quality and safety, which directly affect the quantity of agricultural products demanded at various prices. Price of substitutes and complements, seasonal changes, and government policies such as subsidies or tariffs also significantly shift demand curves. Understanding these determinants helps predict shifts in agricultural market equilibrium and guides policy for sustainable production and consumption.
Price Elasticity of Supply and Demand in Agriculture
The supply curve for agricultural products is typically inelastic in the short term due to factors like growing seasons and limited land availability, causing producers to respond slowly to price changes. Conversely, the demand curve often exhibits more elasticity influenced by consumer preferences, income levels, and substitution effects with non-agricultural goods. Price elasticity of supply and demand in agriculture critically affects market equilibrium, with low supply elasticity leading to greater price volatility in response to demand fluctuations.
Shifts in Supply Curve: Causes and Examples
Shifts in the supply curve for agricultural products occur due to changes in input costs, technological advancements, and climatic conditions, directly impacting production levels. For instance, a decrease in fertilizer prices lowers production costs, shifting the supply curve rightward, increasing quantity supplied at each price. Conversely, adverse weather events like drought reduce crop yields, shifting the supply curve leftward, leading to decreased supply and higher market prices.
Shifts in Demand Curve: Causes and Impacts
Shifts in the demand curve for agricultural products occur due to changes in consumer preferences, income levels, and the prices of related goods, such as substitutes and complements. An increase in income often leads to higher demand for premium agricultural goods, shifting the demand curve rightward, while health trends or policy changes can alter consumer preferences significantly. These shifts impact market equilibrium, influencing prices and production decisions, thereby affecting farmer incomes and resource allocation in the agricultural sector.
Equilibrium Point in Agricultural Markets
The supply curve in agricultural markets typically reflects producers' willingness to sell quantities of crops at varying price levels, while the demand curve represents consumers' willingness to purchase those crops. The equilibrium point occurs where the supply and demand curves intersect, determining the market price and quantity of agricultural products traded. This equilibrium balances surplus and shortage, ensuring optimal allocation of resources within the agricultural economy.
Government Policies Affecting Supply and Demand
Government policies such as subsidies, price supports, and import tariffs significantly influence the supply curve for agricultural products by incentivizing production or restricting input costs. Simultaneously, demand curves are affected by policies including food safety regulations, export restrictions, and nutrition programs that alter consumer preferences and purchasing power. Understanding these policy-driven shifts is crucial for predicting market equilibria and designing effective agricultural economic strategies.
Real-World Case Studies: Supply vs Demand in Agriculture
Supply curves for agricultural products typically reflect seasonal variations and input cost fluctuations, while demand curves exhibit inelastic characteristics due to essential food consumption. Real-world case studies, such as the U.S. corn market, demonstrate how supply shocks from weather events cause significant price volatility despite relatively stable demand. In contrast, rice markets in Asia show demand responsiveness to income growth, shifting demand curves that influence farmer planting decisions and overall market equilibrium.
Related Important Terms
Price Transmission Elasticity
Price transmission elasticity in agricultural economics measures the responsiveness of prices along the supply and demand curves, indicating how changes in market prices affect producers and consumers differently. The supply curve for agricultural products tends to be inelastic in the short term due to production cycle constraints, while the demand curve exhibits varying elasticity depending on consumer preferences and substitute availability.
Vertical Coordination
The supply curve for agricultural products often exhibits greater inelasticity compared to the demand curve due to production constraints and biological growth cycles, emphasizing the importance of vertical coordination to reduce inefficiencies and align supply with market demand. Vertical coordination in agricultural markets optimizes resource allocation by integrating farmers, processors, and distributors, facilitating better price signals and reducing transaction costs that typically distort the supply-demand relationship.
Farmgate Price Differentiation
Farmgate price differentiation reflects how the supply curve for agricultural products shifts due to variations in production costs and output levels at the farm level, while the demand curve reacts to consumer preferences and market conditions influencing price sensitivity. Understanding the interplay between supply elasticity and demand fluctuations is critical for optimizing pricing strategies and forecasting market equilibrium in agricultural economics.
Contract Farming Impact
Contract farming stabilizes the supply curve for agricultural products by guaranteeing farmers a fixed price and market, reducing supply volatility caused by unpredictable demand. This arrangement shifts the demand curve rightward as agribusiness firms secure reliable inputs, increasing overall market efficiency and income predictability for farmers.
Supply Curve Shift due to Weather Shocks
Weather shocks cause significant upward or downward shifts in the supply curve for agricultural products by drastically altering crop yields and production capacity. These supply curve shifts directly impact market prices and availability, with droughts or floods reducing supply and shifting the curve leftward, while favorable weather conditions increase supply and shift the curve rightward.
Demand Elasticity for Organics
Demand elasticity for organic agricultural products tends to be higher compared to conventional goods, reflecting consumers' sensitivity to price changes due to factors like health concerns and environmental awareness. This increased elasticity causes the demand curve for organic products to be more responsive, often leading to larger quantity fluctuations in response to price variations than the relatively inelastic supply curve characteristic of agricultural production constraints.
Market Imperfections in Agri-Supply Chains
Market imperfections in agricultural supply chains cause deviations from the ideal supply and demand curves, leading to price volatility and inefficient resource allocation. Factors such as information asymmetry, transaction costs, and limited market access distort the traditional equilibrium between agricultural supply and demand.
Localized Demand Spikes
Localized demand spikes in agricultural markets cause temporary shifts in the demand curve, leading to higher prices and short-term shortages, while the supply curve remains relatively inelastic due to production constraints and crop cycles. These fluctuations highlight the importance of adaptive supply chain strategies and precise market forecasting to stabilize prices and ensure consistent availability of agricultural products.
Value Chain Integration Effects
Supply curves for agricultural products tend to be inelastic due to production constraints, while demand curves are influenced by consumer preferences and price sensitivity; value chain integration enhances market efficiency by coordinating production, processing, and distribution, thus shifting supply curves rightward and stabilizing prices. Improved information flow and reduced transaction costs within integrated value chains increase responsiveness to demand changes, leading to more balanced supply-demand dynamics and higher overall agricultural profitability.
Perishable Inventory Adjustment
The supply curve for perishable agricultural products often exhibits greater elasticity due to the urgent need for inventory adjustment, as farmers cannot store goods for extended periods without quality degradation. Demand curves in this sector tend to be relatively inelastic since consumer consumption patterns for fresh produce remain stable despite short-term price fluctuations.
Supply curve vs Demand curve for agricultural products Infographic