NDVI mapping offers precise insights into plant health by measuring near-infrared light reflectance, enabling detection of stress and chlorophyll content not visible in standard RGB images. While RGB mapping provides easy-to-understand, high-resolution visuals of crop fields, it lacks the spectral sensitivity required for early detection of vegetation issues. Combining NDVI and RGB mapping enhances overall accuracy in monitoring crop conditions and optimizing precision agriculture practices.
Table of Comparison
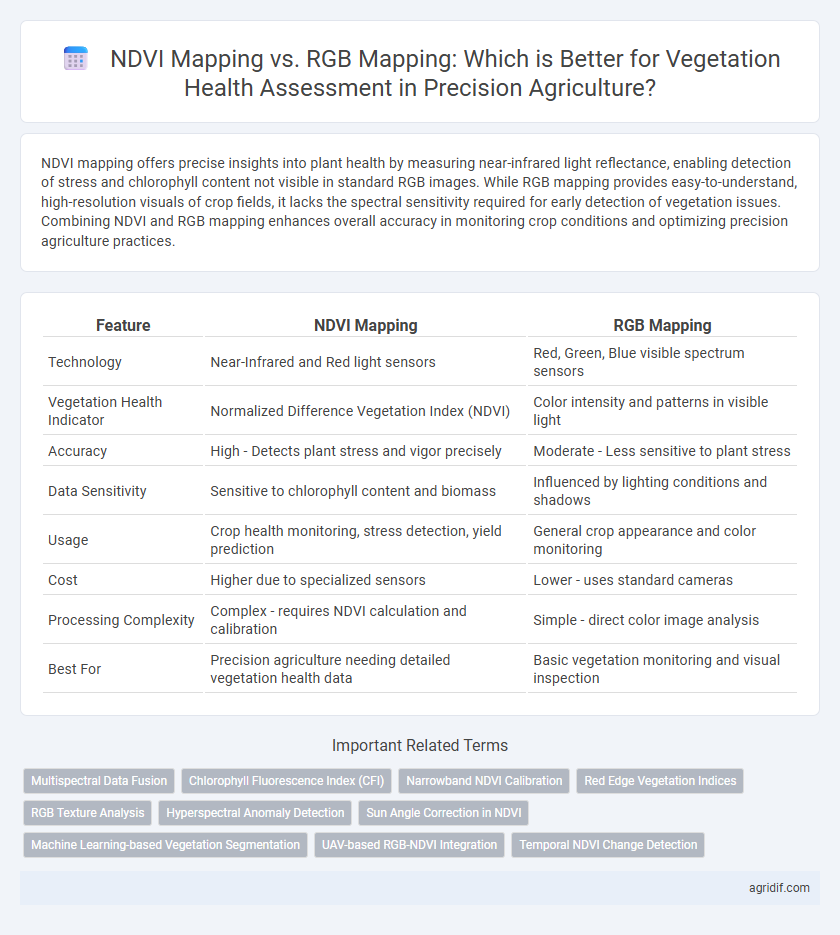
| Feature | NDVI Mapping | RGB Mapping |
|---|---|---|
| Technology | Near-Infrared and Red light sensors | Red, Green, Blue visible spectrum sensors |
| Vegetation Health Indicator | Normalized Difference Vegetation Index (NDVI) | Color intensity and patterns in visible light |
| Accuracy | High - Detects plant stress and vigor precisely | Moderate - Less sensitive to plant stress |
| Data Sensitivity | Sensitive to chlorophyll content and biomass | Influenced by lighting conditions and shadows |
| Usage | Crop health monitoring, stress detection, yield prediction | General crop appearance and color monitoring |
| Cost | Higher due to specialized sensors | Lower - uses standard cameras |
| Processing Complexity | Complex - requires NDVI calculation and calibration | Simple - direct color image analysis |
| Best For | Precision agriculture needing detailed vegetation health data | Basic vegetation monitoring and visual inspection |
Introduction to Vegetation Health Assessment Technologies
NDVI mapping utilizes near-infrared and red light reflectance to accurately quantify vegetation health and stress levels, offering superior sensitivity to plant chlorophyll content compared to RGB mapping. RGB mapping relies on visible light imagery to assess color variations in vegetation but lacks the precision to detect subtle physiological changes in plants. Integrating NDVI technology in precision agriculture enables early detection of crop stress, optimizing resource management and improving yield outcomes.
Understanding NDVI Mapping in Precision Agriculture
NDVI mapping leverages normalized difference vegetation index values derived from near-infrared and red light reflectance to provide precise insights into plant health, vigor, and stress levels. Unlike RGB mapping, which relies on visible light spectrum data and is less sensitive to subtle vegetation changes, NDVI offers quantitative measurements that enable early detection of crop stress and optimized resource management. This spectral analysis enhances decision-making in precision agriculture by ensuring accurate monitoring of crop conditions and improving yield predictions.
Fundamentals of RGB Mapping for Crop Monitoring
RGB mapping captures visible light reflected by crops, enabling detailed visual representation of plant color and structure for crop monitoring. This method uses standard cameras to detect variations in green intensity, which correlate with plant vigor and stress levels but lacks the spectral sensitivity of NDVI to near-infrared wavelengths. RGB mapping provides accessible, cost-effective data for early disease detection and growth monitoring, forming a fundamental tool in precision agriculture for immediate vegetation health assessment.
Comparison of Data Acquisition Methods: NDVI vs RGB
NDVI mapping utilizes near-infrared and red light reflectance to accurately measure vegetation health, providing quantifiable data on plant vigor and stress levels, whereas RGB mapping relies solely on visible light, limiting its effectiveness in detecting subtle differences in plant health. NDVI sensors commonly capture multi-spectral imagery using specialized cameras, enabling high-sensitivity detection of chlorophyll activity, while RGB mapping employs standard cameras that offer broader but less precise spectral information. The superior sensitivity of NDVI data acquisition makes it fundamental for precision agriculture applications needing detailed vegetation assessment, contrasting with the more accessible yet less precise RGB mapping.
Accuracy in Vegetation Health Detection: NDVI and RGB Perspectives
NDVI mapping leverages near-infrared and red light reflectance to provide precise quantification of vegetation health by detecting chlorophyll activity, enabling early stress identification beyond visible symptoms. RGB mapping relies solely on red, green, and blue light, offering a general visual representation but lacking sensitivity to subtle physiological changes in plants. Consequently, NDVI delivers superior accuracy in monitoring crop vigor and detecting vegetation stress compared to traditional RGB imaging in precision agriculture.
Case Studies: Real-World Applications of NDVI and RGB Mapping
Case studies demonstrate that NDVI mapping provides more accurate and quantifiable data on vegetation health by analyzing near-infrared reflectance compared to RGB mapping, which relies solely on visible light and is less sensitive to subtle plant stress. In vineyards and wheat fields, NDVI mapping enabled early detection of nutrient deficiencies and water stress, leading to targeted interventions and yield improvement. Conversely, RGB mapping proved useful for quick assessments and large-scale monitoring but lacked the precision required for detailed crop management decisions.
Cost and Accessibility: Evaluating NDVI and RGB Systems
NDVI mapping utilizes multispectral sensors to measure plant health by detecting specific wavelengths, offering precise vegetation indices but often at higher costs and complexity. RGB mapping relies on standard cameras to capture visible light, making it more affordable and accessible for widespread use, though with reduced accuracy in detecting subtle plant stress. Farmers and agronomists balance the trade-off between NDVI's detailed, costly data and RGB's budget-friendly, user-friendly approach to optimize crop monitoring strategies.
Visual Outputs: Interpreting NDVI and RGB Maps
NDVI mapping provides precise visualization of vegetation health by highlighting variations in plant vigor through near-infrared reflectance, enabling early detection of stress not visible in RGB images. RGB mapping offers natural color visuals but lacks the spectral sensitivity to detect subtle physiological changes, making it less effective for detailed health assessments. Interpreting NDVI maps requires understanding color gradients that indicate plant health, while RGB maps rely on visible color changes, often missing critical early-stage stress signals.
Integration with Farm Management Systems
NDVI mapping offers precise vegetation health insights by analyzing near-infrared reflectance, enabling early detection of crop stress, which significantly enhances integration with advanced farm management systems for proactive decision-making. RGB mapping provides high-resolution visual data but lacks the spectral specificity of NDVI, limiting its effectiveness in accurately assessing plant health when combined with automated agricultural software. Leveraging NDVI data within farm management platforms optimizes resource allocation, crop monitoring, and yield prediction, driving improved operational efficiency and sustainability in precision agriculture.
Future Trends in Vegetation Health Assessment Technologies
NDVI mapping offers precise spectral information by measuring near-infrared reflectance, enabling early detection of plant stress and nutrient deficiencies, which RGB mapping cannot accurately capture. Future trends emphasize integrating multispectral and hyperspectral sensors with AI-driven analytics to enhance real-time vegetation health assessments beyond traditional NDVI and RGB capabilities. Advanced satellite and drone platforms equipped with these technologies aim to provide higher-resolution, continuous monitoring, driving more proactive and data-driven decision-making in precision agriculture.
Related Important Terms
Multispectral Data Fusion
NDVI mapping utilizes multispectral data fusion by combining near-infrared and red light reflectance to precisely assess vegetation health, offering higher accuracy in detecting plant stress compared to traditional RGB mapping. This integration of multispectral sensors improves early disease detection, nutrient deficiency identification, and overall crop monitoring in precision agriculture.
Chlorophyll Fluorescence Index (CFI)
NDVI mapping offers superior precision in detecting variations in vegetation health by leveraging near-infrared reflectance correlated with chlorophyll fluorescence, whereas RGB mapping primarily captures surface color without directly measuring chlorophyll activity. The Chlorophyll Fluorescence Index (CFI) integrated with NDVI improves early stress detection in crops by quantifying photosynthetic efficiency, enabling more accurate monitoring and targeted interventions in precision agriculture.
Narrowband NDVI Calibration
Narrowband NDVI calibration enhances precision agriculture by providing accurate vegetation health assessment through specific wavelengths that capture plant chlorophyll reflectance, outperforming broad-spectrum RGB mapping in detecting subtle stress variations. This calibration allows for reliable quantification of crop vigor and biomass, enabling targeted interventions and optimized resource allocation.
Red Edge Vegetation Indices
Red Edge Vegetation Indices provide enhanced sensitivity to chlorophyll content and stress detection compared to traditional NDVI and RGB mapping by capturing reflectance in the critical red edge spectral band, enabling more accurate vegetation health assessment in precision agriculture. Integrating Red Edge data improves crop monitoring precision, supports early detection of plant stress, and optimizes input application, driving higher yields and resource efficiency.
RGB Texture Analysis
RGB texture analysis enhances vegetation health assessment by capturing spatial patterns and surface variability in crop canopies, offering detailed insights beyond standard NDVI mapping that primarily measures spectral reflectance. This method utilizes high-resolution RGB images to detect subtle stress indicators and canopy structural changes, improving early disease detection and precision management decisions in precision agriculture.
Hyperspectral Anomaly Detection
NDVI mapping leverages near-infrared and red light reflectance to quantify vegetation health, offering precise detection of plant stress compared to RGB mapping, which relies on visible light and provides limited spectral information. Hyperspectral anomaly detection enhances this process by analyzing hundreds of narrow spectral bands, enabling early identification of subtle physiological changes and improving targeted interventions in precision agriculture.
Sun Angle Correction in NDVI
NDVI mapping provides more accurate vegetation health assessment than RGB mapping by quantifying plant chlorophyll content through specific near-infrared and red light reflectance, while applying sun angle correction reduces data variability caused by changing solar positions. Sun angle correction enhances NDVI's reliability by normalizing reflectance values across different times of day and seasons, thereby improving the precision of crop stress detection and yield predictions in precision agriculture.
Machine Learning-based Vegetation Segmentation
NDVI mapping leverages spectral data to highlight vegetation health by quantifying chlorophyll content, enabling machine learning models to accurately segment crops based on physiological conditions. RGB mapping, while offering high-resolution visual detail, often requires complex feature extraction to effectively train machine learning algorithms for precise vegetation segmentation in precision agriculture.
UAV-based RGB-NDVI Integration
UAV-based RGB-NDVI integration enhances vegetation health assessment by combining high-resolution RGB imagery with precise NDVI data, improving crop stress detection accuracy. This fusion leverages the strengths of both spectral reflectance indices and color-based analysis, enabling more detailed and timely decision-making in precision agriculture.
Temporal NDVI Change Detection
Temporal NDVI change detection offers precise monitoring of vegetation health by capturing subtle variations in plant vigor over time, surpassing RGB mapping's limitations in differentiating stress levels due to its spectral sensitivity. NDVI maps, generated from near-infrared and red light reflectance, provide quantifiable indices that enable early detection of crop stress and improved decision-making in precision agriculture.
NDVI Mapping vs RGB Mapping for Vegetation Health Assessment Infographic